I couldn’t find any articles that summarize third-party electoral performance in detail. This post does so, in extensive detail, which makes it both unique and boring. It’s a source blogpost, not a narrative blogpost. If you’d like to read a normal article, read my next blogpost, “Third Parties Can Win, If They Simply Secure the Mandate of Heaven or Good Electoral Laws”. (Not yet posted.)
The Democrats and the Republicans hold nearly all political power in the United States. Many leftists and progressives want to end this by building a “third party” left of the Democratic Party.
This goal is worthwhile. The two-party system is undemocratic, dysfunctional, and stops leftist policy goals.
This goal is also currently totally infeasible. Election laws in the United States make a third party unviable in almost all elections.
When third-party advocates say, “They’re electable if you vote for them!”, they’re nearly always wrong. Third parties lose for structural reasons.
This blogpost will show that:
Very few federal elections are won by third party candidates
Very few state legislature elections are won by third party candidates
Very few local elections are won by third party elections
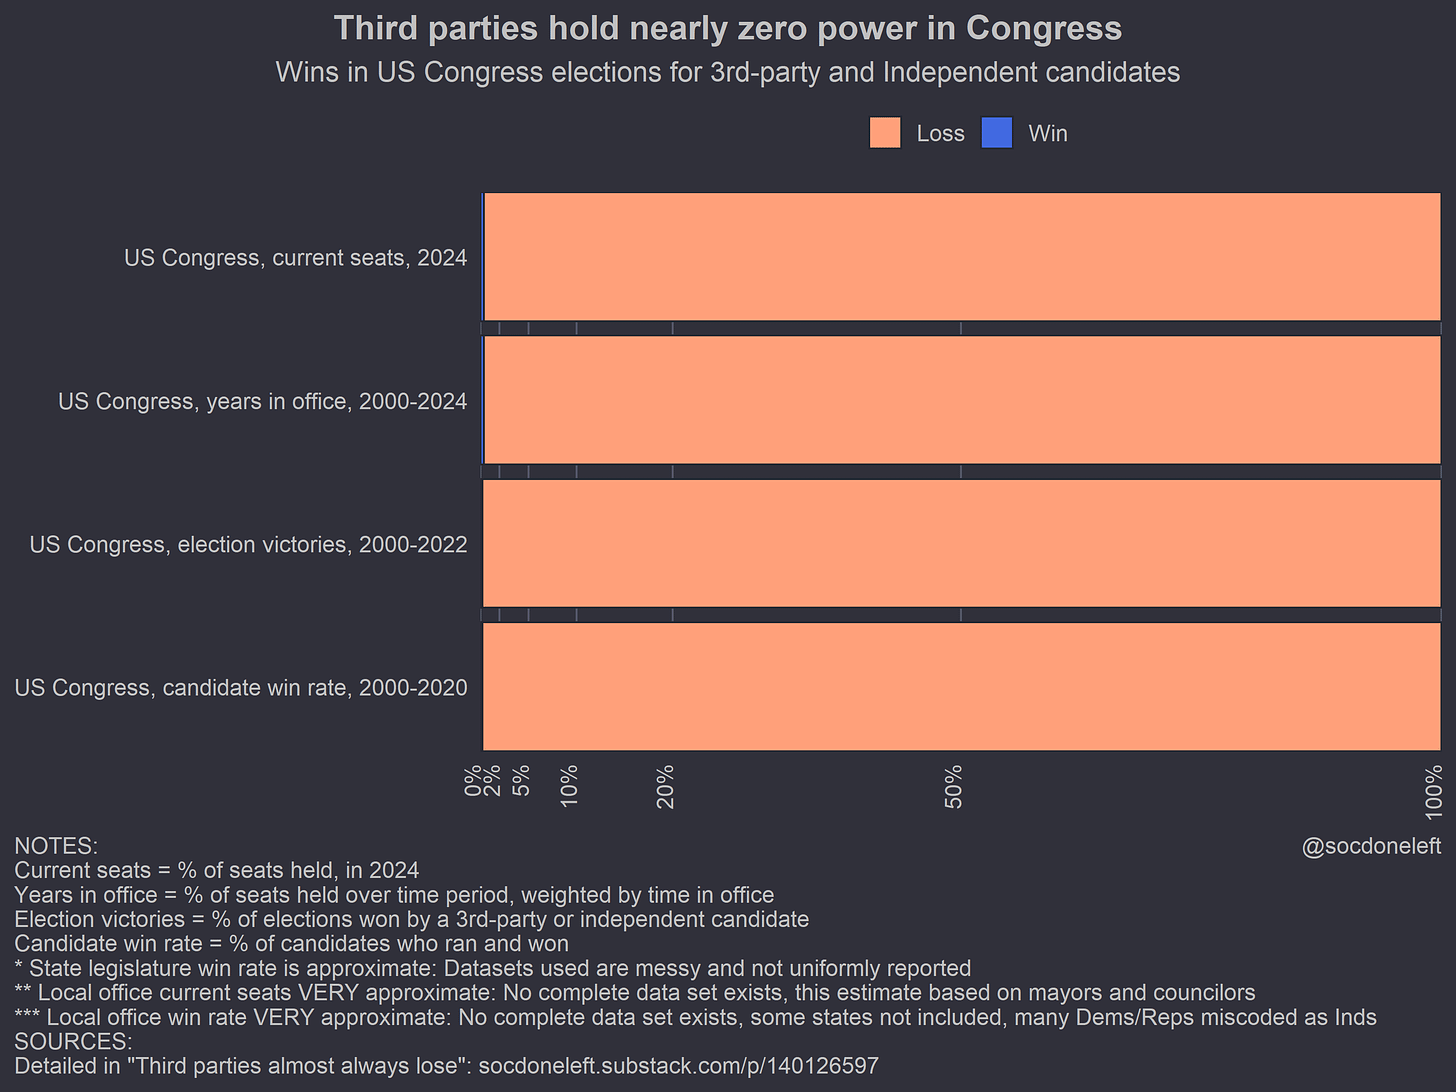
This entire blogpost can be summarized in one graph:
1: How often do third parties win federal office?
Since 2000, no independent or party candidate has won the Presidency. The strongest Green candidate received 2.7% of the vote (-45.6pp) in 2000; the strongest Libertarian candidate received 3.3% of the vote (-44.9pp) in 2016.
It’s reasonable to expect third parties to do poorly in “bigger” offices – especially the Presidency, the biggest of all. Third parties don’t have the same national fundraising and organizing infrastructure that Democrats and Republicans do.
What about Congress?
Congress has few “true” Independents. Most nominally independent candidates are tightly tied to one political party. These independent-in-name-only (IINO?) candidates are sometimes called independent Democrats or independent Republicans.
Since 2000, just 5 people have won an election to either chamber of Congress without running on a Democratic or Republican ballot line:
>>> Don’t care about the details? Start skipping here. >>>
Joe Lieberman (1989-2013): An Independent Democrat for one election:
US Senate: In 1988, 1994, and 2000, Lieberman won the Democratic primary and the general election. In 2006, Lieberman lost the Democratic primary. In the general, Lieberman ran on the “Connecticut for Lieberman” ticket and won, 49.7% (I) to 39.7% (D) to 9.6% (R). Lieberman remained a member of the Democratic party. In the Senate, Lieberman was listed as an “Independent Democrat” and continued to caucus with Democrats. Lieberman did not run in 2012.
Bernie Sanders (1991-current): A true-ish Independent, but tied to Democrats:
US House: In 1988, Sanders ran as an Independent without the support of the Democratic party. Sanders lost, 41.2% (R) to 37.5% (I) to 18.9% (D). In 1990, Sanders lost the Democratic primary but received its unofficial support, most of its endorsements, and nearly all of its voters. Sanders won, 56.0% (I) to 39.5% (R) to 3.0% (D). The same happened in 1992, 1996, 2000, and 2004. In contrast, Sanders won the Democratic primary outright (as a write-in) in 1994, 1998, and 2002.
US Senate: In 2006, 2012, and 2018, Sanders won the Democratic primary but ran as an Independent. Sanders consistently caucuses with the Democrats.
Virgil Goode: A conservative Democratic who ran as Independent for one election before switching to Republican; arguably an Independent Republican:
US House: In 1996 and 1998, Goode won the Democratic primary and the general election. In 2000, Goode switched to Independent and won the general election – though only a Democrat ran against him. In the House, Goode immediately caucused with the Republicans. In 2002, Goode switched to Republican and won the general election. In 2004 and 2006, Goode ran as a Republican. In 2008, Goode lost to a Democrat.
Lisa Murkowski (2002-current): Never an independent:
US Senate: In 2002, Murkowski was appointed to her father’s Senate seat. In 2004, 2016, and 2022, Murkowski won the Republican primary and the general election. In 2010, Murkowski lost the Republican primary. In the general, Murkowski ran a write-in campaign and won, 39.5% (R) to 35.5% (R) to 23.5% (D). Murkowski remained a Republican throughout.
Angus King (2013-current): A true-ish Independent, but tied to Democrats:
Several more third party or Independent representatives are not included, because they never won an election after leaving the major parties:
Jim Jeffords never won election as an Independent
Kyrsten Sinema never won election as an Independent
Bob Smith never won election as an Independent
Justin Amash never won election as an Independent or Libertarian
Paul Mitchell never won election as an Independent
Dean Barkley never won election at all
Sources: MIT Election Data + Science Lab (MEDSL) U.S. Senate 1976-2020 and U.S. House 1976-2022 datasets; Wikipedia; Ballotpedia
>>> Stop skipping here. >>>
In short: 2 of 5, Joe Lieberman and Lisa Murkowski, were both strong partisans that got bucked in one party primary but won their general anyway. 1 of 5, Virgil Goode, was arguably an Independent Republican. Just 2 of 5 were true-ish electoral independents: Bernie Sanders and Angus King have repeatedly ran against both parties – though Sanders hasn’t had to run against a Democrat for Congress since 2004.
How much power have these candidates held? Let’s summarize:
Percent of election wins: US Congress has held about 6,100 elections since 2000.
The 2 true-ish Independents (and Goode) have won 6+3+1 = 10, or 0.16% of the total.
If we add Murkowski and Lieberman, that yields 10+2 = 12, or 0.20% of the total.
Percent of member-years: US Congress holds 535 voting members. It’s been 25 years since 2000. Ignoring vacancies, that yields a total of 25*535 = 13,375 “member-years”.
The 2 true-ish Independents (and Goode) have held office for a combined 25+13+2 = 40 member-years, or 0.30% of the total.
If we add Murkowski’s 2011-2017 term and Lieberman’s 2007-2013 term, that yields 40+6+6 = 52 member-years, or 0.39% of the total.
The metrics above are estimates of power: What percent of seats are held and how many elections are won by third-party and Independent candidates. Another metric worth consideration is the “win rate” of third-party candidates. (Most seats are not contested by any serious third-party candidates.)
If a third-party candidate runs for Congress, how likely are they to win? Using MEDSL’s Senate and House election datasets again, we can estimate:
From 2000 to 2020, 4569 third-party and Independent candidates ran for US Congress. 10 won. That’s a 0.2% win rate.
In short: Since 2000, Democrats and Republicans have won 99.8% of elections to US Congress and held 99.6% of its members. No third party won a single election to US Congress. When third-party candidates do run, they lose 99.8% of the time.
2: How often do third parties win state legislative offices?
Perhaps US Congress is still too big for third parties to compete. In competitive elections (where no candidate won >80% of the vote) to the US House, the median winner gets about 160,000 votes.
Instead, let’s look at state legislatures, where a typical winner gets about 5,000 to 25,000 votes.
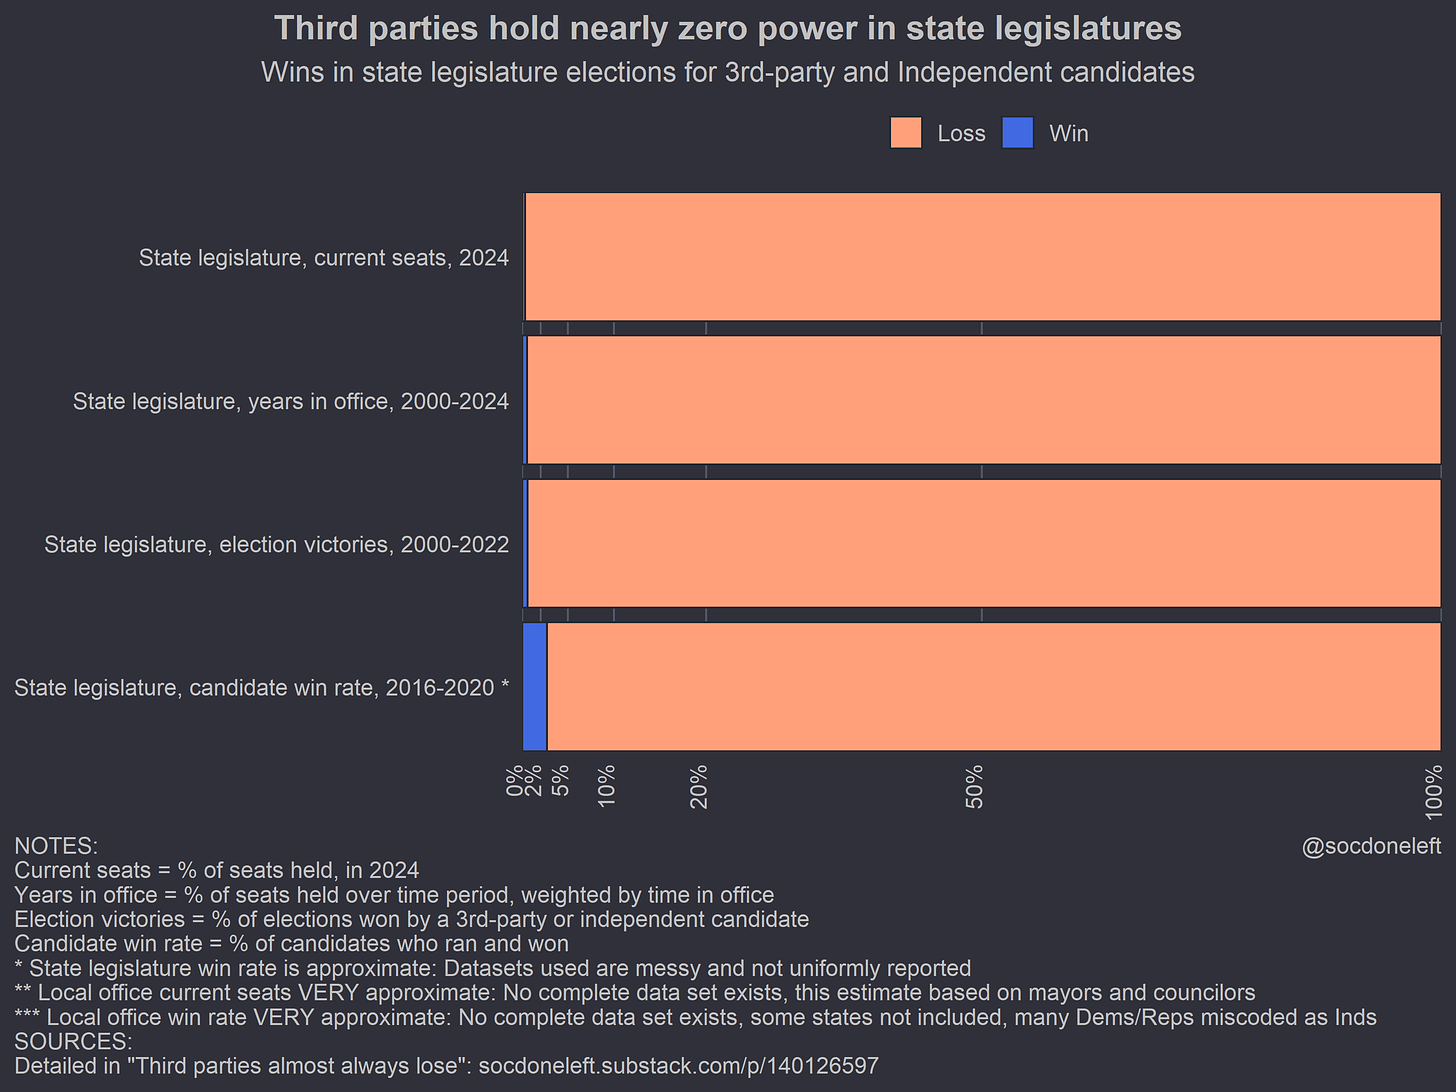
The National Conference of State Legislatures reports that, 7341 of 7367 (99.65%) of non-vacant state legislator seats are currently held by Democrats or Republicans.
Compared to the federal legislature, state legislatures have far more Independents – around ~15 in an average year. Some of these are true Independents. (For example, see Jason Grenn of no party or Kent Ackley of “Your Local Independent Party”.) Some of these are Independent-Democrats or Independent-Republicans. (For example, see Kelvin Butler, who caucused with Dems, or Jed Lipsky, endorsed by the Reps.) Usually, state Dems don’t run against Ind-Dems and state Reps don’t run against Ind-Reps.
Because state legislatures get far less media coverage, it’s much harder to determine which Independents are “true” Independents. Instead, the list below focuses only on third-party candidates.
To my knowledge, here is a complete list of third-party state legislators who first won that office while running on a straight third-party ticket since 2000 – basically, no electeds who switched party or ran on a fusion ballot:
>>> Don’t care about the details? Start skipping here. >>>
First, everywhere but Vermont:
Marshall Burt (2021-2023), true Libertarian:
Wyoming State House: Burt won in 2022 by running as the sole non-Democrat: From 1996 to 2018, the Democrats (Chris Boswell, then Stan Blake) ran unopposed. Both were conservative Dems. Burt was the first conservative non-Dem to run since the 1990s, and won by just 275 votes (+8.7pp). In the very next general, Burt lost by 1177 votes (-49.7pp) to a Republican.
Richard Carroll (2008-2009), Democrat-Green:
Arkansas State House: Carroll won in 2008 solely because he ran unopposed. He received 4261 votes (89.3%) – a strong showing! Then in 2009, he switched to the Democratic party and promptly lost the primary by 1264 votes (-60.7pp).
John Eder (2003-2007), true Green:
Maine State House: In 2002 and 2004, Eder won the Green primary and general elections. In 2006, Eder lost to a Democrat.
Steve Vaillancourt (2001-2002), Libertarian for just one election:
New Hampshire State House: In 1996 and 1998, Vaillancourt won the Democratic primary and general election.
State Senate: In 2000, Vaillancourt lost the Democratic primary. Instead, he ran and won as Libertarian. In 2002, he switched to Republican and won the general election.
Vaillancourt won 1345 votes (18.9%) in 1998, 1622 votes (19.8%) in 2000, and 1667 votes (18.0%) in 2002.
Audie Bock (1999-2000), Green for just one election:
California State Senate: In the 1999 special election, Audie Bock won by luck: Bock received 8.7pp in the blanket primary, just enough to squeak into the top-two general. Her Democratic opponent Elihu Harris sent a mailer to Black neighborhoods that promised fried chicken to voters who chose him. She won by 327 votes (+0.9pp) in the general, which had a turnout of just 15.5%. In 2000, Bock switched to being an Independent. In 2000, the Democrats ran a competent candidate, who defeated Bock by 52,633 votes (-45.2pp).
That’s 2 true third-party legislators and 3 opportunist party switchers.
Just in Vermont:
David Zuckerman (1994-current): True Progressive, then a Progressive-Democrat:
Vermont State House (1995-2011): From 1994 to 2008, Zuckerman won the Progressive primary and the general election.
Vermont Senate (2013-2017): From 2012 to 2014, Zuckerman won the Progressive primary, the Democratic primary, and the general election.
Vermont Lieutenant Governor (2017-2021, 2023-2027): In 2016 and 2022, Zuckerman won the Progressive primary, the Democratic primary, and the general election. In 2020, Zuckerman did not run. (A Democrat won.)
Steve Hingtgen (1999-2005): True Progressive:
Vermon State House: In 1998, 2000, and 2002, Hingtgen won the Progressive primary and the general election (top-2). In 2004, Hingtgen ran for Lieutenant Governor and lost.
Carina Driscoll (2001-2003): True Progressive:
Vermont State House: In 2000, Driscoll won the Progressive primary and the general election. In 2002, Driscoll did not run, because their district was merged into Zuckerman and Corren’s district. In 2018, Driscoll ran for Burlington mayor and lost.
Bob Kiss (2001-2006): True Progressive:
Vermont State House: In 2000-2004, Kiss won the Progressive primary and the general election. In 2006, Kiss ran for Burlington mayor and lost. In 2009, Kiss ran for Burlington mayor and won.
That’s 4 true third-party legislators.
Sources: Klarner State Legislative Election Returns (SLER) 1967-2016; MIT Election Data + Science Lab (MEDSL) State Precinct-Level Returns 2016, 2018, 2020; Wikipedia; Ballotpedia
>>> Stop skipping here. >>>
In short: In the past 25 years, the US has elected 6 true third-party state legislators. Of those, 2/3 came from Vermont. (Make a note of Vermont and fusion voting – they will be important in section 3.)
How badly do third parties do? Let’s consider three categories:
[A] True third-party legislators elected on a straight-ballot (6 people, 1+2+8+3+1+3 = 18 elections, 2+4+16+6+2+5 = 35 years)
[B] Above, plus party-switchers first elected on a straight third party ticket (3 people, 1+1+1 = 3 elections, 1+1+1 = 3 years)
[C] Above, plus Independents (~15 people on average), plus other party-switchers (~10 people on average)
There are currently ~7,390 state legislature seats in the United States.
Percent of election wins: Ignoring special elections, state legislatures have held approximately 88,680 elections since 2000.
[A] True third-party legislators won 18/88680 = 0.02%
[B] Legislators first elected on a straight third party ticket won (18+3)/88680 = 0.02%
[C] All non-major-party legislators won ~(18+3+20*25)/88680 = 0.59%
Percent of member-years: State legislatures hold ~7,390 voting members. It’s been 25 years since 2000. Ignoring vacancies, that yields a total of 25*7390 = 184,750 “member-years”.
[A] True third-party legislators held 35/184750 = 0.02%
[B] Legislators first elected on a straight third party ticket won (35+3)/184750 = 0.02%
[C] All non-major-party legislators won ~(35+3+20*2*25)/184750 = ~0.56%
If a third-party candidate runs for a state legislature seat, how likely are they to win? MEDSL’s state legislature datasets are useful again, though they’re far messier and far more incomplete than the MEDSL US Congress datasets. It’s not clear how many third-party candidates simply go unreported by their state election systems. With those caveats:
From 2016 to 2020, 733 third-party and Independent candidates ran for US Congress. 20 won. That’s a 2.7% win rate.
In short: Since 2000, Democrats and Republicans have won ~99.4% of elections to state legislatures and held ~99.4% of its members. No third party won a single election to US Congress. When third-party and Independent candidates run for state legislatures, they lose 96.3% of the time.
3: How often do third parties win local offices?
Perhaps state legislatures are still too big. What about local elections?
Unfortunately, no comprehensive dataset on local elections or local elected officials exists. As such, I can’t calculate the statistics used above: Percent of seats held by third parties or percent of elections won by third parties.
The number is almost certainly very small. To see why, let’s do a shitty approximation:
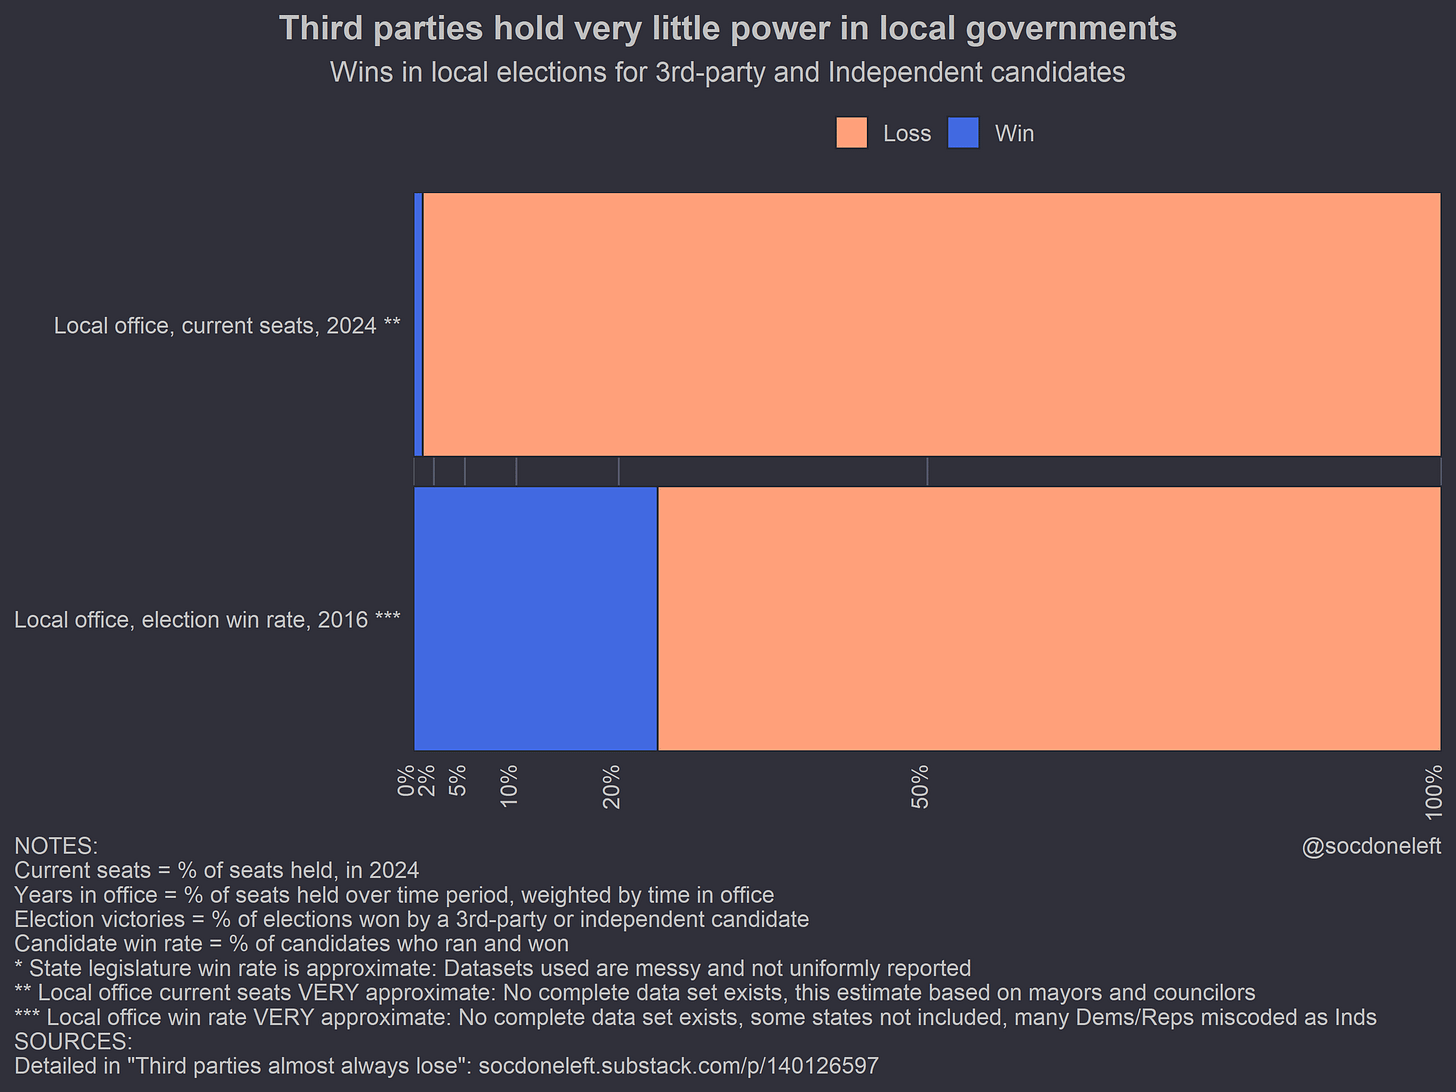
The US has about 1620 mayors in cities above 30,000 residents and about 4250 incorporated towns above 10,000 residents. We can approximate this data to about 3,200 mayors (many towns are council-only) and, at an average of ~9 local councilors, about 38,250 local councilors.
The Green Party currently holds 4 mayors and 17 local councilors (GP, Wikipedia). The Libertarian Party holds 10 mayors and 6 local councilors (LP, Wikipedia). Let’s assume that other third parties and independents actually hold tons of mayors and councilors and, under the principles of PIDOOMA, multiply this by 10 times: That’s 140 mayors and 230 local councilors. (For comparison, the Wikipedia page for “third-party and independent performances in United States mayoral elections”, which is focused on “notable” mayors, lists 2 currently-serving mayors and 6 non-Dem/Rep mayors elected since 2000. Of the 50 biggest cities in the US, 4 are run by Independents – all elected in nonpartisan elections.)
If we accept the approximation above, then third parties and independents won:
4.4% of mayors in the United States
0.6% of local councilors in the United States
0.9% of both mayors and local councilors
Fortunately, we’re not stuck with my shitty approximation. Scholars are slowly building data on local elections across the United States. Consider two new-ish datasets:
First, de Benedictis-Kessner et. al 2023’s “Local Elections Database” (LEDB) covers the vast majority of local election winners in cities with over 50,000 residents from 1989 to 2021.
Even here, third party winners are rare – so rare that the LEDB codes every single winner either as “probable-Democrat” or “probable-Republican”. That approximation is reasonable for their purposes, but makes the data useless for estimating third-party win rates.
Second, MIT’s Election Data and Science Lab (MEDSL) compiled the Local Precinct-Level Returns 2016 dataset, which includes ~13,060 local elections across 34 states in 2016. Unfortunately, this dataset has several big flaws:
Due to incomplete coverage (of all states and all local elections), it’s not representative of the US as a whole
It often miscodes candidates into the wrong party, especially fusion and nonpartisan candidates
That said, it’s the best we’ve got – and it lets us approximate the “win rate” for local offices.
If a third-party candidate runs for a state legislature seat, how likely are they to win?
In 2016, in the MEDSL dataset, 493 third-party and Independent candidates ran for local offices. 117 won. That’s a 23.7% win rate – ten times better than the state legislature win rate!
In short: We have no idea what percent of local offices are held by third parties and independents. Among mayors and councilors, it’s likely around 1%. When third-party and Independent candidates run for state legislatures, they lose 76.3% of the time.
Conclusions and shilling
In short: Third parties and Independents hold almost zero federal, state, and local seats. Third-party and Independent candidates almost always lose federal and state elections, and usually lose local elections. These facts are not inevitable: Third parties and Independents do much better in smaller races – and, as I will show in the next blogpost, where good electoral laws exist.
The topic of all elections in the United states is fairly large, and it's almost certain that I've fucked a few details up somewhere in this article. Please reply or DM me with any corrections!
I’m writing blogs on socialist and progressive topics. To support my work:
Subscribe on Substack:


